
GLPI Signal
An event and alert pipeline with on-call paging, for GLPI 11.
Monitoring stays where it is. Alerts from Zabbix, Prometheus, a backup tool or an RMM converge here: they deduplicate into one record per condition, resolve to the right entity’s asset, page a human, escalate when nobody answers, and become a ticket in the right entity when your rules say so.
Compared to core’s mail collector
Section titled “Compared to core’s mail collector”| Mail collector (core) | This plugin | |
|---|---|---|
| Intake | One ticket per email | Token-authenticated webhook, email, or an in-process call |
| Repeats | A new ticket per message | count++ on one record, one followup per interval |
| Recovery | Another ticket | Closes the alert; never closes the ticket |
| Identity | The subject line | A fingerprint, normalised so a moving reading is one condition |
| Who to wake | A notification to a static group | A rota with layers, handover and escalation on no-ack |
| Suppression | None | Maintenance windows, per entity and per CI |
| Audit of paging | None | One row per page sent, with outcome and acknowledgement |
Features
Section titled “Features”Ingest. A token-authenticated endpoint with optional HMAC body signing. Three parsers: Prometheus Alertmanager natively, a generic JSON mapper, and a classifier for alert-shaped email arriving through GLPI’s mail receivers.
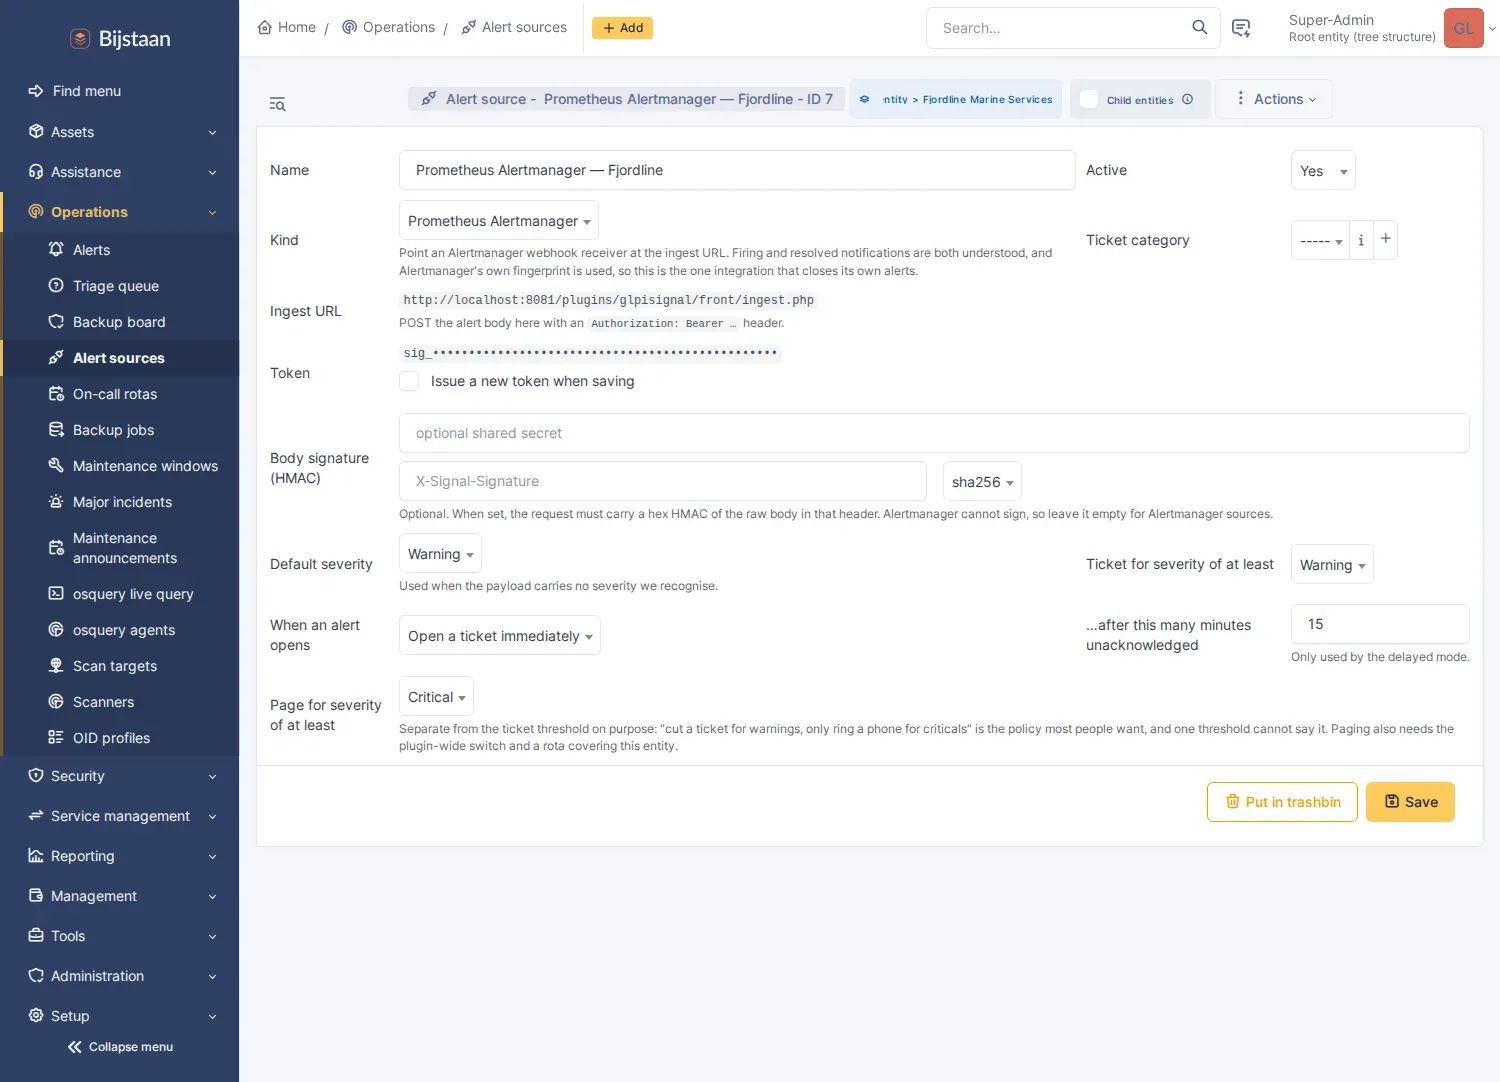
Deduplicate. Every alert gets a fingerprint — the sender’s own where it has one, otherwise derived from labels, otherwise from host plus a normalised summary, so “disk 91.4% full” and “disk 92.1% full” are one condition. Repeats increment a counter rather than inserting rows.
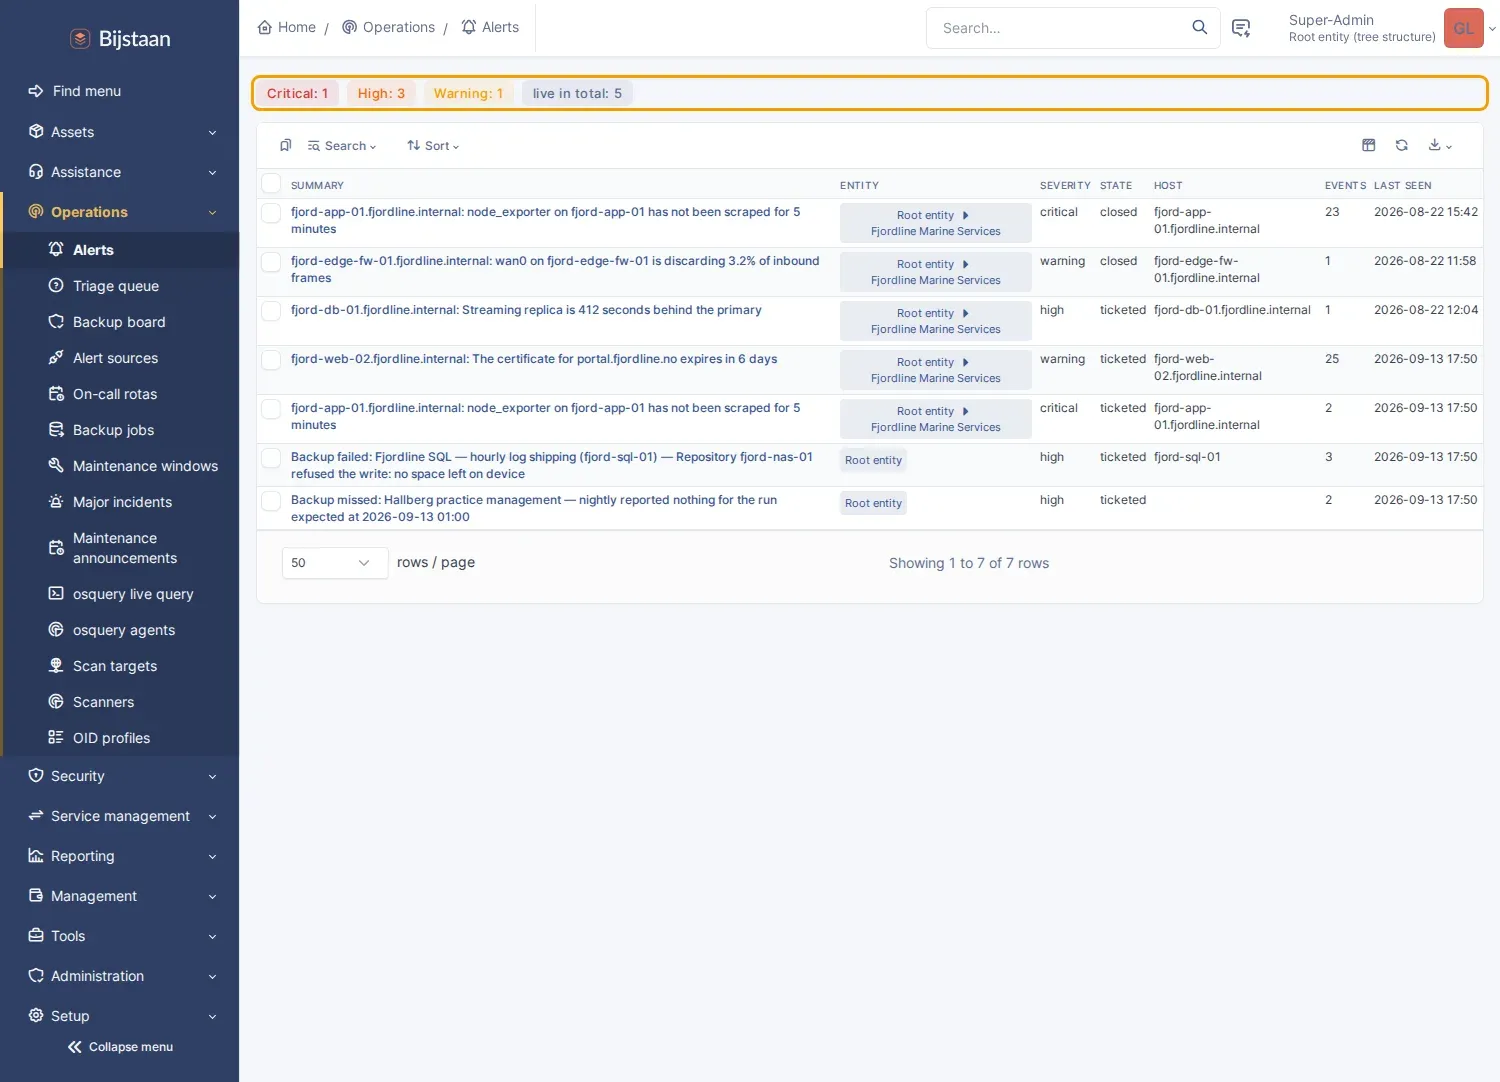
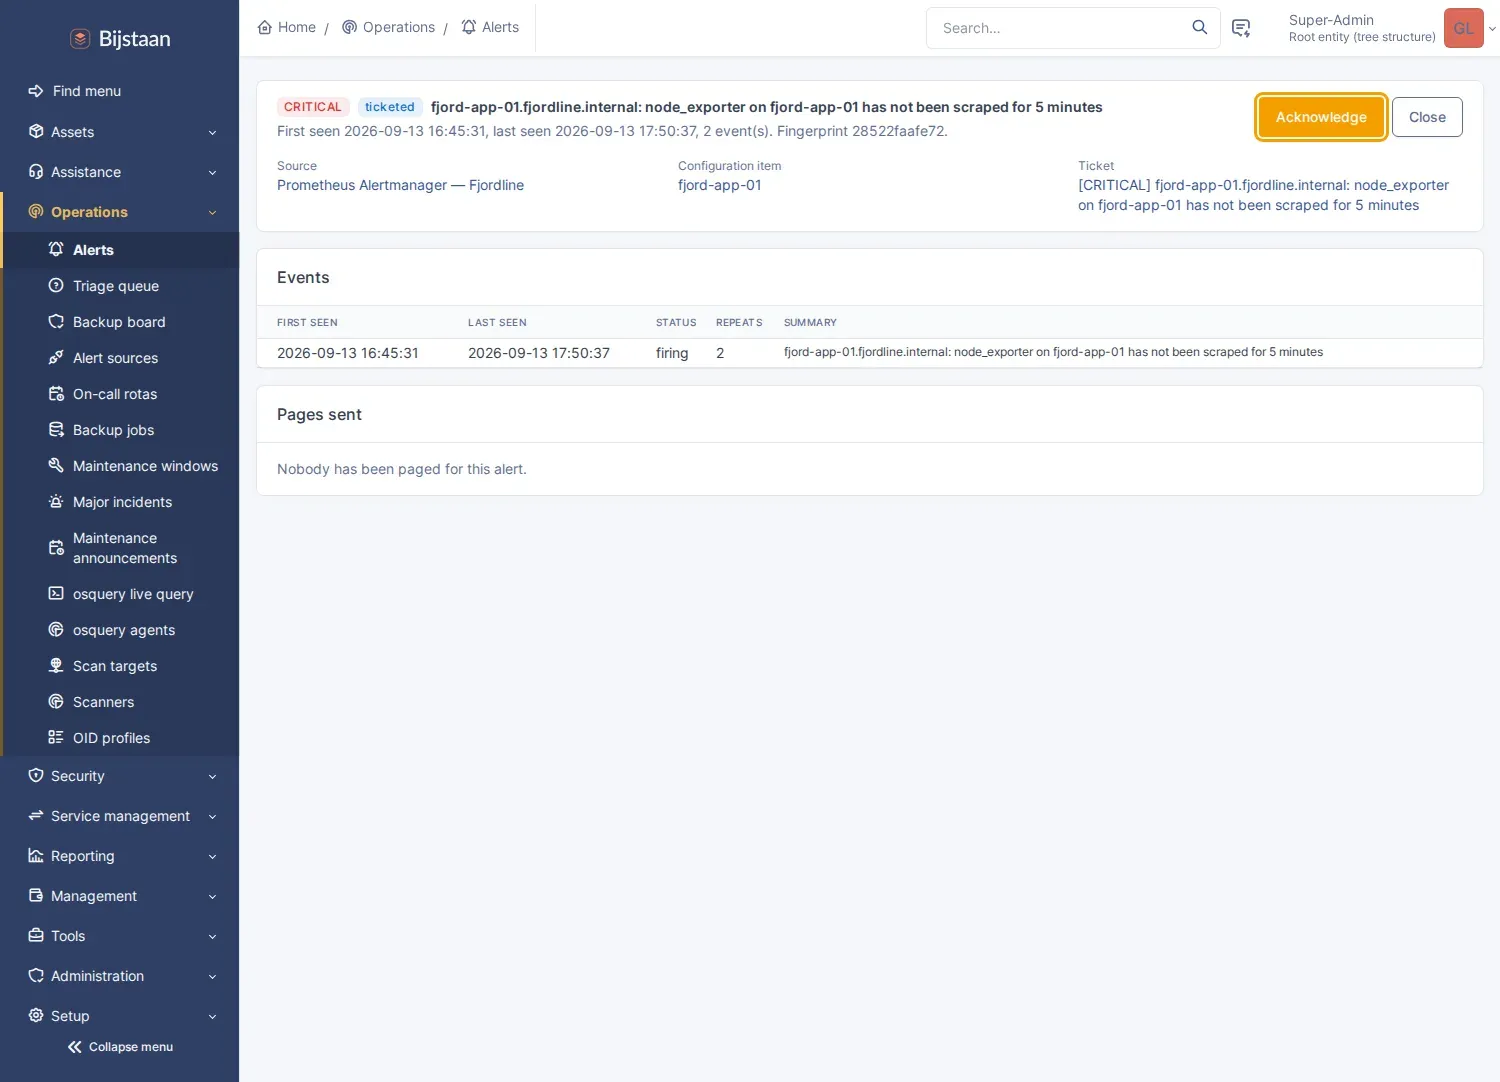
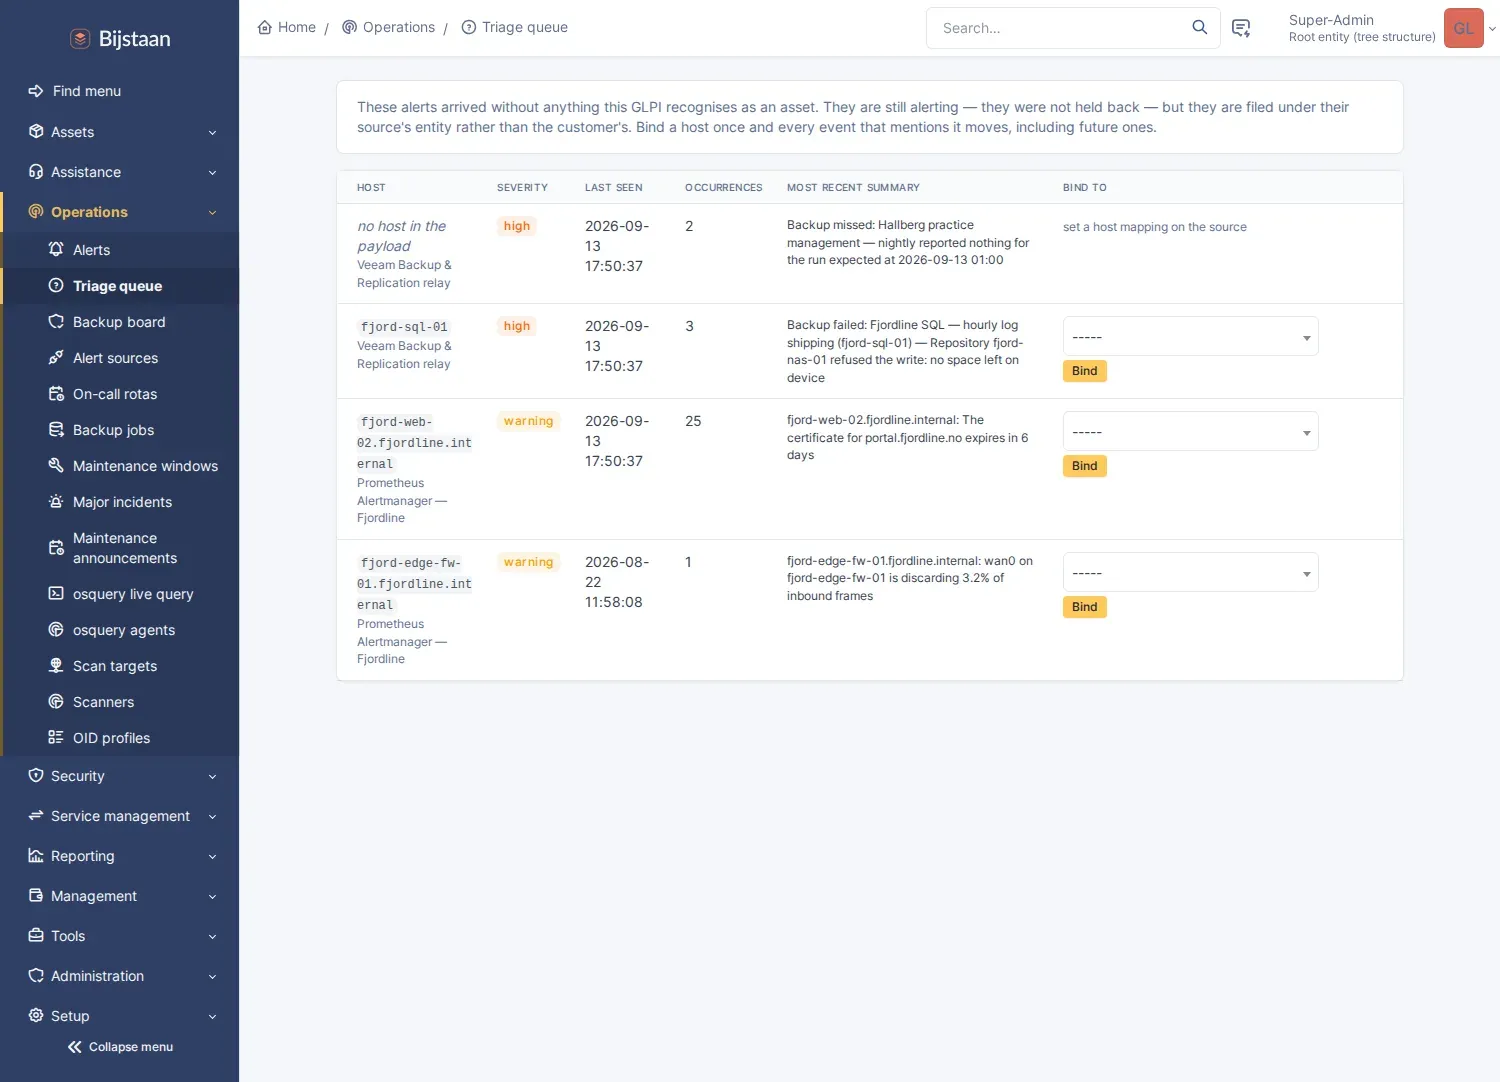
Resolve. Serial, then MAC, then IP, then hostname, against computers, network
equipment and printers and their ports. The matched asset supplies the entity, so
the ticket lands on the right one. Ambiguity is treated as no match — every
estate has four machines called srv-dc01. Unmatched alerts still fire and appear
in a triage queue, where binding a host once moves every event that mentioned it.
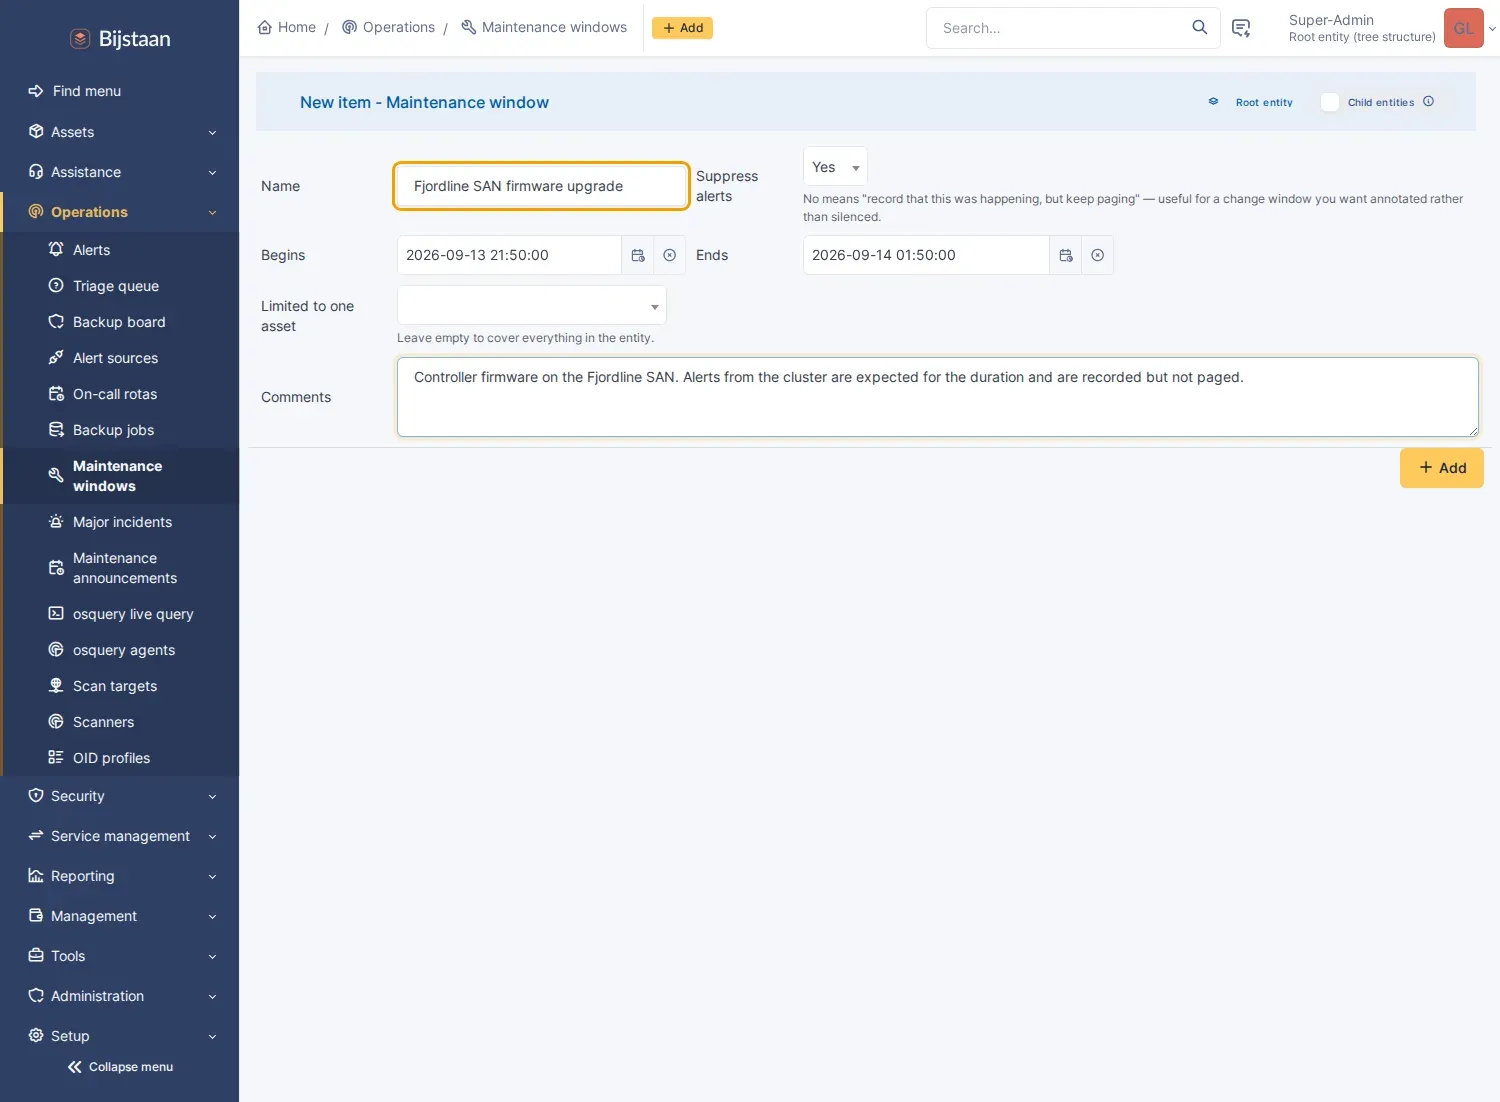
Suppress. Maintenance windows per entity, optionally narrowed to one CI. A window stops ticketing and paging, never recording. If the window closes with the condition still firing, the alert comes back.
Decide. Per source: ticket immediately, ticket after N minutes unacknowledged, or record only, with a severity threshold. Paging has its own separate threshold, so “ticket for warnings, ring a phone only for criticals” is expressible.
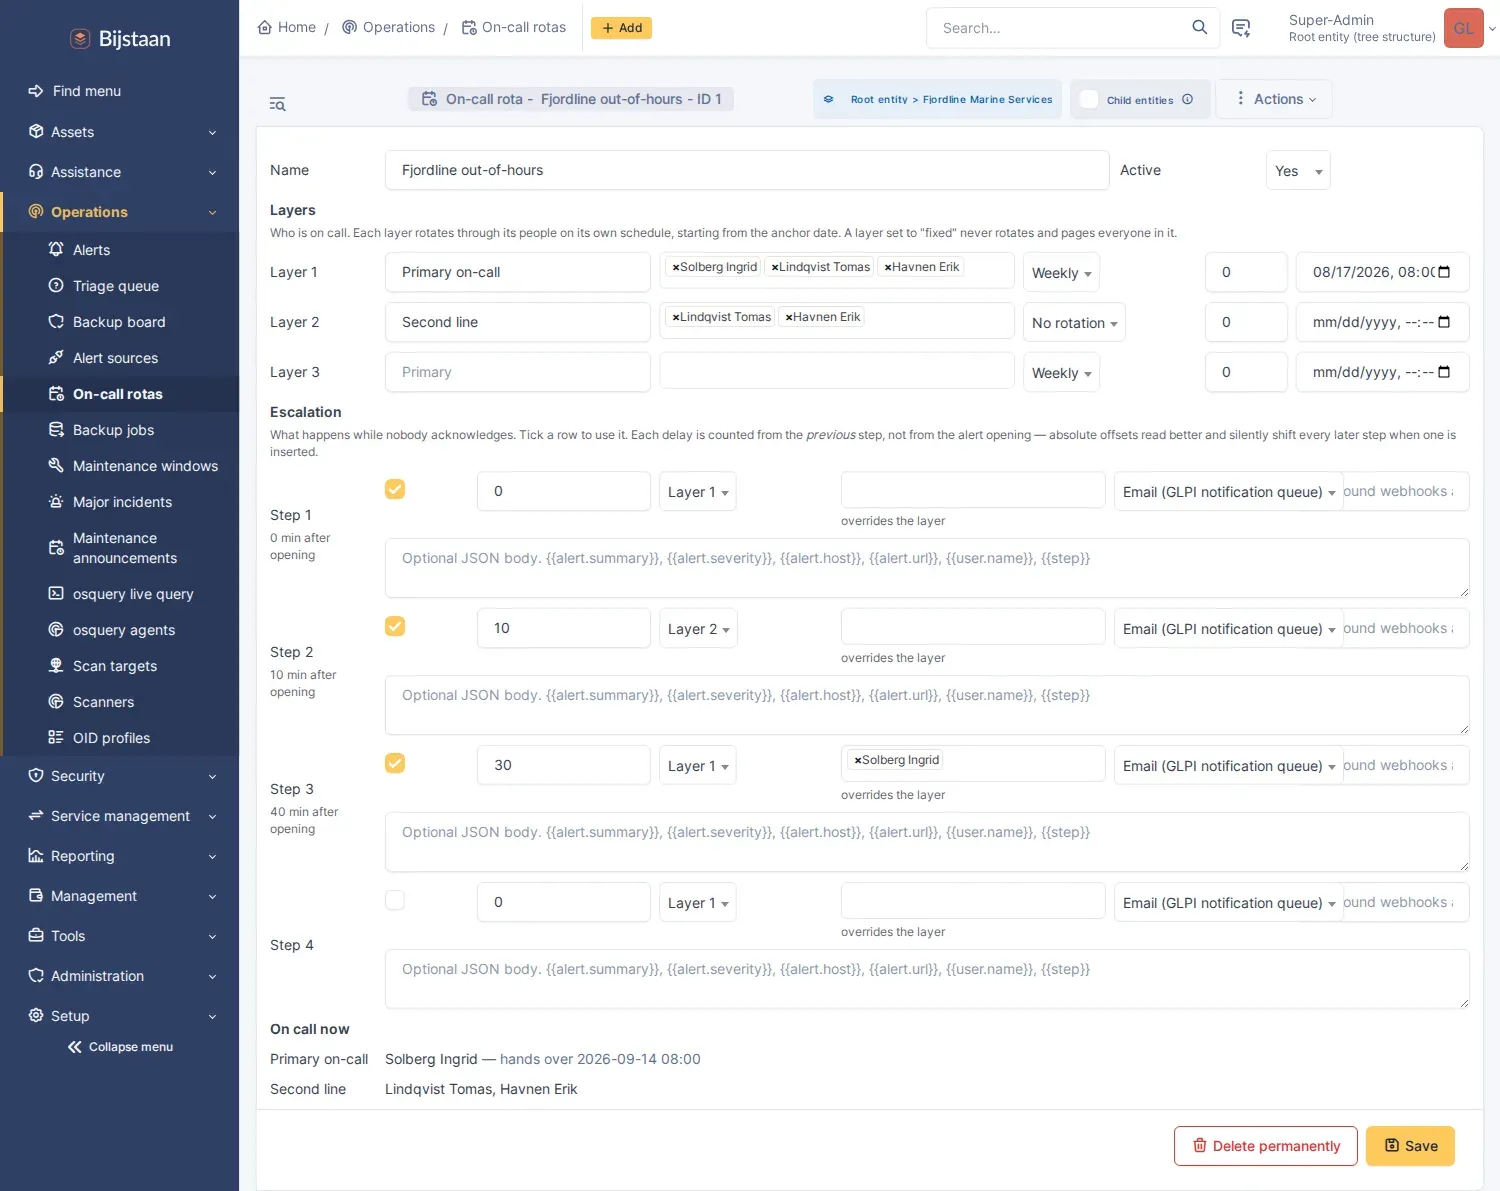
Page. Rotas with ordered layers, each rotating daily, weekly, fortnightly or on a custom period from an anchor instant. Who is on call is computed at render time, never stored. Escalation steps fire in order with a delay measured from the previous step; an acknowledgement stops the chain. Every page is a row with channel, literal target and outcome.
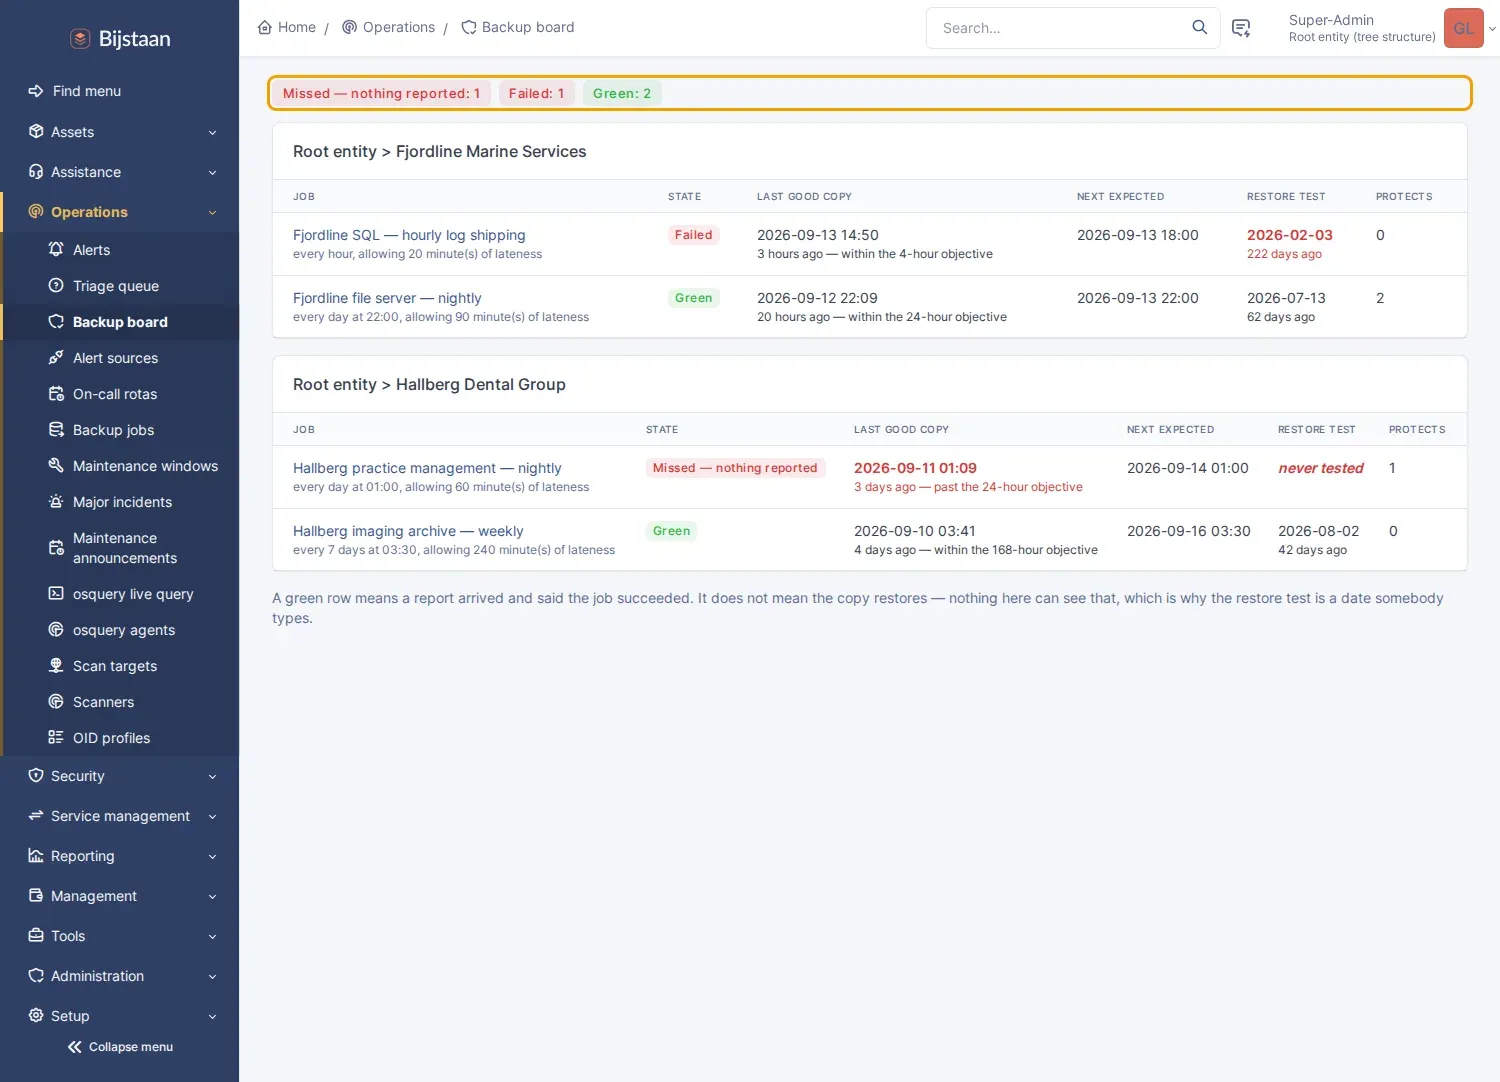
Backup dead-man switch. Model each job: how often it should report, how late is too late, how much data may be lost, and which CIs it protects. Results arrive as ordinary alerts and a green run closes the previous night’s failure. A cron works out which jobs have gone quiet and raises one alert per overdue period, through the same deduplication, suppression, ticketing and paging.
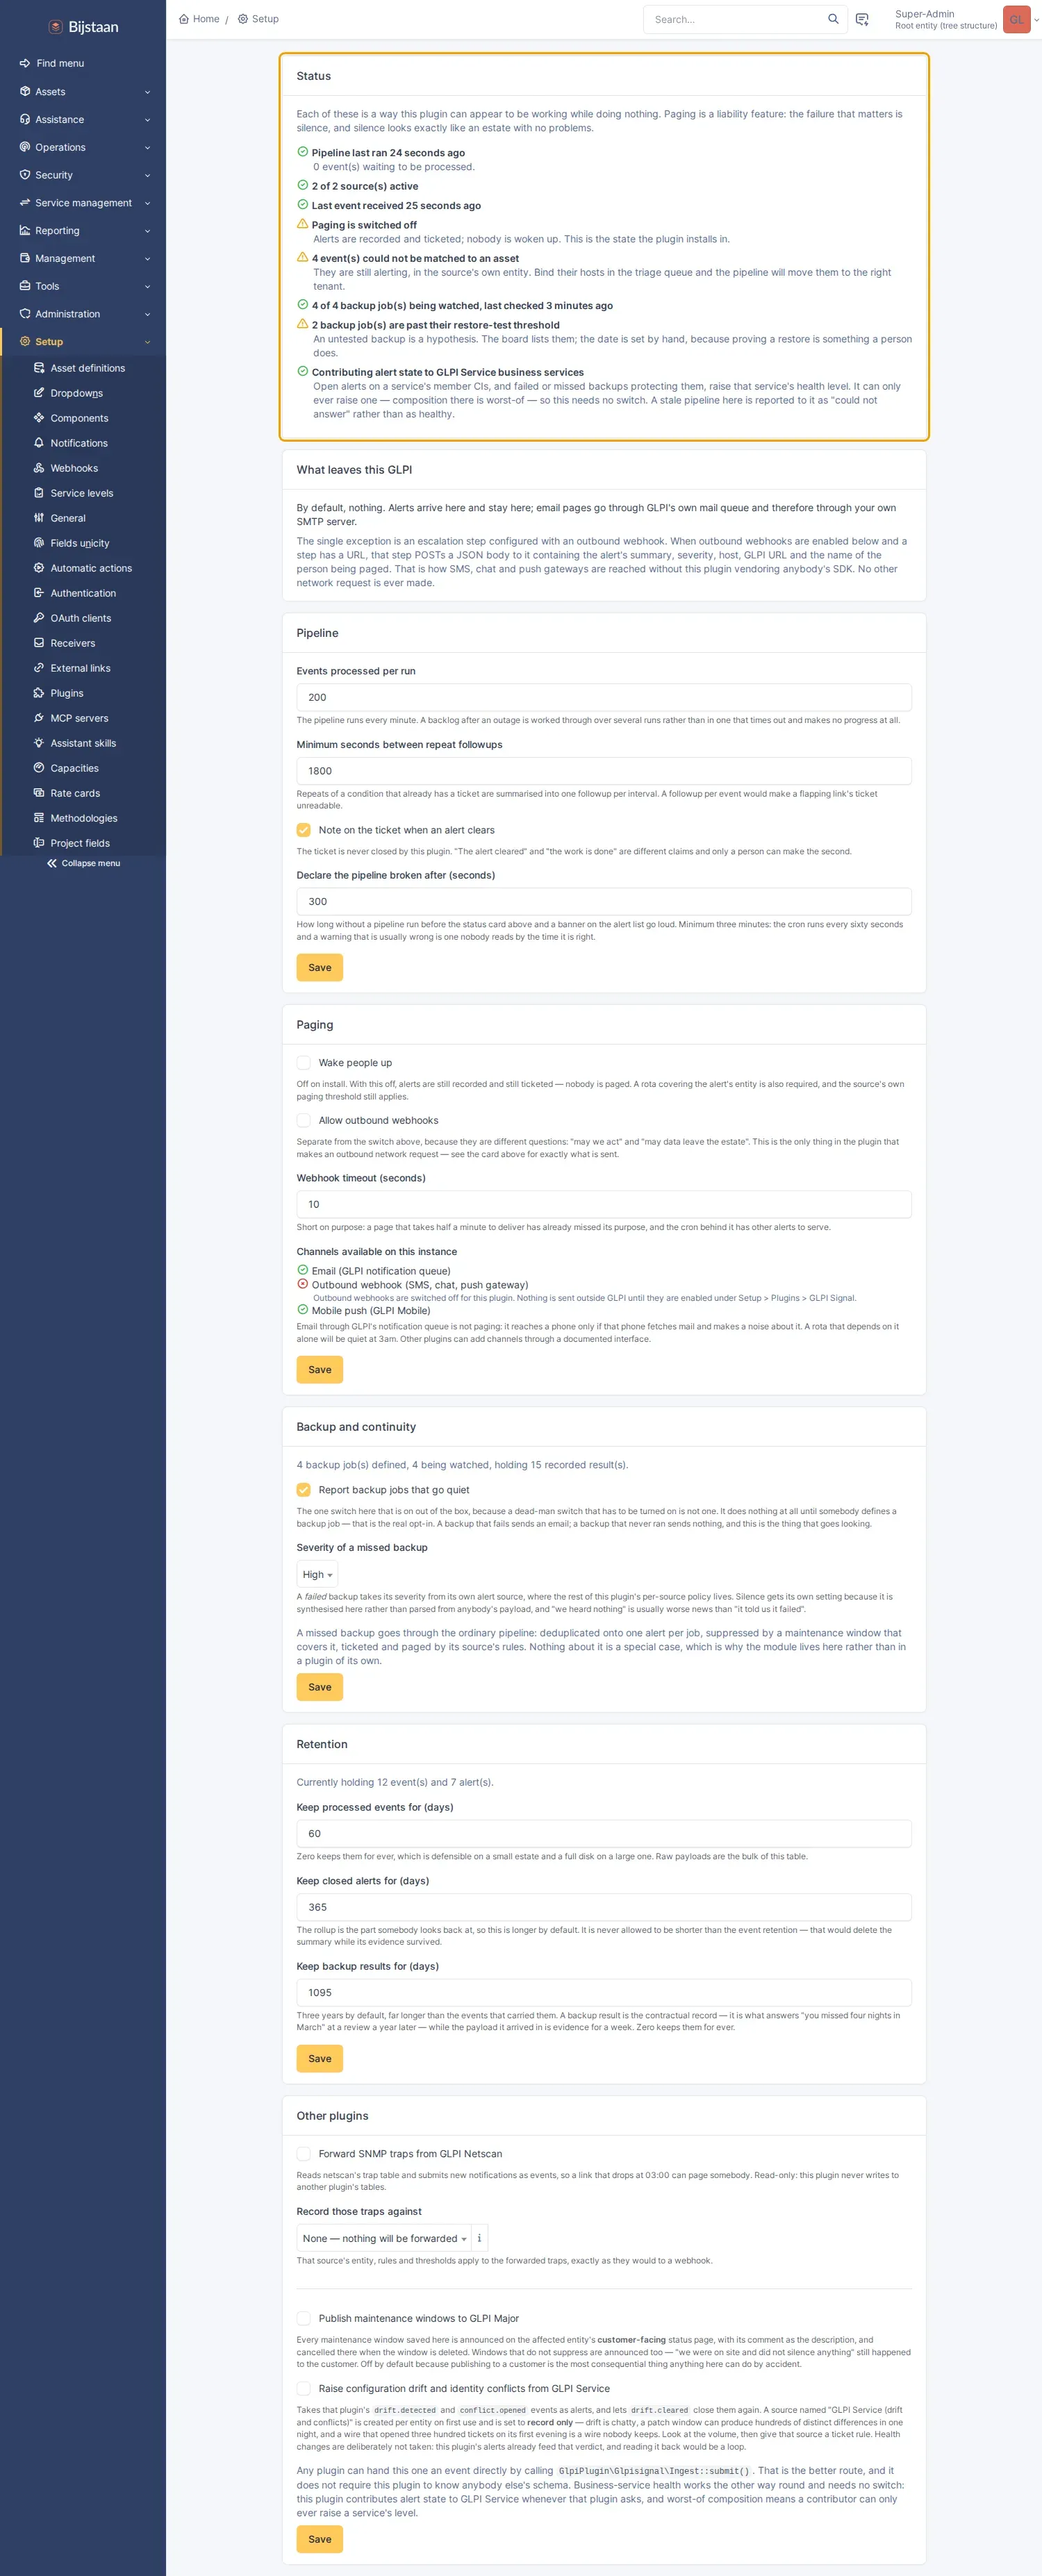
Self-reporting. The pipeline cron writes a heartbeat every minute; the settings page and a banner on the alert list go loud when it stops.
- It does not poll anything. No checks, probes or agents of its own.
- It does not graph anything and stores no time series.
- It is not a monitoring system — it is the alert-handling half of one. Every threshold deciding whether something is wrong lives in the tool that measured it.
- It never closes a ticket. A cleared alert adds a followup saying so.
- It does not take or test backups. It records what your backup product said, notices when it says nothing, and keeps the date somebody last proved a restore.
- It sends nothing outside your estate by default. Email pages go through GLPI’s own mail queue. The one optional outbound webhook is off until enabled, and the settings page states exactly what is sent.
Install
Section titled “Install”# from the GLPI rootgit clone https://github.com/bijstaan/glpi-signal.git plugins/glpisignalphp bin/console plugin:install -u glpi glpisignalphp bin/console plugin:activate glpisignalThen, in order:
- Administration → Alerting → Alert sources — add a source, save it, copy the token, point your monitoring at the ingest URL shown.
- Setup → Automatic actions — confirm
glpisignal / pipelineandglpisignal / escalationare enabled. Nothing works without the first. - Setup → Plugins → GLPI Signal — read the status card.
- Once alerts arrive correctly: add a rota, then switch paging on.
- For backups: add a source of kind Backup job results, then define jobs
under Administration → Alerting → Backup jobs. Confirm
glpisignal / backupdeadmanis enabled.
Settings
Section titled “Settings”| Setting | Default | Notes |
|---|---|---|
| Events processed per run | 200 | The pipeline runs every minute; a backlog is worked over several runs |
| Repeat followup interval | 1800s | Repeats on a ticketed alert are summarised once per interval |
| Note when an alert clears | on | A followup on the ticket. The ticket is never closed |
| Declare the pipeline broken after | 300s | Minimum 180s; the cron runs every 60s |
| Wake people up | off | Alerts are still recorded and ticketed with this off |
| Allow outbound webhooks | off | The only thing here that makes an external request |
| Webhook timeout | 10s | |
| Keep processed events | 60 days | Raw payloads are the bulk of the storage; 0 keeps them for ever |
| Keep closed alerts | 365 days | Never allowed shorter than the event retention |
| Report backup jobs that go quiet | on | A dead-man switch that has to be turned on is not one. Does nothing until a job exists |
| Severity of a missed backup | high | A failed backup takes severity from its source; silence gets its own |
| Keep backup results | 1095 days | The contractual record |
| Forward netscan SNMP traps | off | Read-only; needs glpinetscan active and a destination source |
| Publish maintenance windows to GLPI Major | off | Announces on a public status page |
| Take drift and conflicts from GLPI Service | off | Auto-provisions a per-entity source set to record only |
Per-source settings — parser kind, field mappings, severity defaults, ticket and paging thresholds, mail patterns — live on the source record.
Rights
Section titled “Rights”| Right | For | Granted at install to |
|---|---|---|
plugin_glpisignal_alert |
See alerts and the triage queue (READ); acknowledge, close, bind a CI (UPDATE) | Profiles holding ticket UPDATE |
plugin_glpisignal_config |
Sources, rotas, maintenance windows, backup jobs, settings | Profiles holding config UPDATE |
Two rather than one: the rota and the paging policy are administrative; acknowledging a page at 3am is not, and gating an ack behind the configuration right would mean the person being woken cannot stop the escalation.
Integration
Section titled “Integration”All optional, guarded on both the plugin being active and the class or method existing. The plugin installs, runs and passes its tests with none present.
- glpiai —
signal_recent_alertsandsignal_alert_context, read-only, gated on the alert right. They answer what else was going wrong at the time. - glpiservice (health) — contributes open alerts on a service’s member CIs, and failed or missing backups protecting them. No switch: composition is worst-of, so a contributor can only raise a level. A stale pipeline reports could not answer rather than healthy.
- glpiservice (events) — optionally takes
drift.detectedandconflict.openedas alerts and letsdrift.clearedclose them. Off by default; lands on an auto-provisioned per-entity source that records only. - glpimajor — optionally announces every maintenance window on the affected entity’s status page and cancels it when the window is deleted. Off by default.
- glpireport — the backup module publishes
Backup\Report::forEntity()for a quarterly review generator. - glpisop — a backup job can name a restore procedure by id. A free reference, not a foreign key.
- glpinetscan — an optional read-only bridge forwards SNMP traps as events. It never writes to netscan.
- glpimail — the page’s wording is a real GLPI notification template,
described to glpimail through its
glpimail_lettershook. With glpimail installed a page arrives as the house card with a full-width Acknowledge button; without it, the seeded template renders as plain HTML. - Dashboards — three cards: live alerts by severity, events per day, backup job state.
Page wording
Section titled “Page wording”The body comes from a NotificationTemplate seeded at install, named On-call
page, editable under Setup → Notifications → Templates. GLPI renders it, so
##lang.*## labels arrive in the language of the engineer being woken rather
than the cron’s.
Delivery did not move. Who gets paged is the rota, not a notification target: the escalation engine knows whose shift it is, which step this is and whether the previous went unacknowledged. The plugin queues its own rows and reports per-recipient outcomes.
That template is therefore listed under Notifications with no Notification
using it. Wiring one would not make it send, and would imply switching it off
would stop the paging. If the template is missing or fails to render, the channel
falls back to a PHP-composed body.
The subject is [CRITICAL] <what broke> with no [GLPI] prefix, since the first
characters of a lock-screen preview decide whether somebody gets up. Optional
fields are guarded, so a page never reads Affected item: followed by nothing.
Limitations
Section titled “Limitations”- Email is not paging. The default channel queues mail through GLPI, which reaches a phone only if that phone fetches mail and makes a noise. Use an outbound webhook to an SMS or push provider for anything you intend to be woken by.
- Resolution depends on the sender. Alertmanager reports when a condition clears; most things do not. A source with no status mapping produces alerts a human closes.
- CI matching is only as good as the inventory. A host GLPI has never inventoried cannot be matched, and a hostname appearing twice is no match.
- The pipeline is a cron. Worst case is roughly a minute from delivery to page, plus GLPI’s own notification cron for email. The alternative is a daemon, which is a second thing to supervise.
- Dashboard cards are entity-restricted and dashboards are shared, so two people comparing the same card may legitimately disagree.
- Backup schedules are not cron expressions — every N hours, or every N days at HH:MM, with a grace window. Weekday-only and monthly schedules cannot be described; use a wider grace window or a maintenance window.
- A green backup means a report arrived saying so. It does not mean the copy restores. The restore test is a date somebody types, and the board nags when it goes stale. RTO is recorded and never measured.
- A retried backup delivery is counted twice unless the sender stamps it. A result whose job, outcome and sender-supplied timestamp all match an existing one is skipped; with no timestamp there is no guard.
docker compose -p glpi exec glpi sh -c 'cd /var/www/glpi/plugins/glpisignal && tests/run.sh'tests/parsers.php, tests/escalation.php and tests/backup.php need nothing
but PHP: parsers, fingerprint, severity vocabulary, schedule maths, paging rules,
backup recurrence and RPO arithmetic, and the map between severities and
business-service health levels. tests/backup.php pins its timezone, since its
interesting assertions are about clock changes.
tests/pipeline.php and tests/backup-live.php need an active install and write
to it, creating and removing a source, a backup job, alerts, results, a window
and a ticket, including on failure. Run with tests/run.sh --live.
cd tests/browser && SHOT_DIR=../../docs/screenshots node signal-check.jssignal-check.js POSTs a real Alertmanager delivery and a run of backup results
to the ingest endpoint, runs both crons, then asserts what the pages say: the
alert list shows the condition and no dead-man banner, Acknowledge sticks, the
triage queue offers the unmatched host, the rota names whoever is on call, the
maintenance-window form saves both ends, the board distinguishes ok from failed
from missed, and the status card describes this instance rather than the
defaults. It takes the screenshots above.
Licence
Section titled “Licence”GPL-3.0-or-later, the same licence as GLPI. The plugin is loaded into GLPI’s process and extends its classes, so it is a derivative work. See LICENSE.